2019-2020: 4th Quarter (January, February, March 2020)
Table of contents
Overview
- Nutrition North Canada (NNC) provided over $22 million in subsidy during January, February, March 2020. This represents an increase of 2% compared to the same period last year.
- In August 2019, the new seasonal transportation subsidy, meant to subsidized items transported into communities on either sea barges or on ice roads began. This subsidy level accounted for 2% of total spending this quarter.
- The highest subsidy level, or the targeted subsidy, accounted for 15% of total subsidy spending this quarter.
- The medium level subsidy (the former highest level) accounted for 70% of subsidized dollars.
- The lowest level subsidy accounted for 13% of all subsidized dollars.
Data by product category
This table shows the amount of subsidy that was distributed by product category between January 1, 2020 and March 31, 2020, and the quantity of products that were subsidized during this period. Product categories are listed in descending order based on the amount of subsidy. The category that received the highest amount of subsidy is listed first, followed by the category that received the second highest amount of subsidy, and so on. Numbers in the table are preliminary. Values are subject to change.
| Product category | Subsidy | Volume | ||
|---|---|---|---|---|
| Value ($) | % of Total | Weight (kg) | % of Total | |
| Fruit and vegetables (fresh and frozen) | 6,583,192 | 29.1% | 2,180,140 | 27.3% |
| Milk (fresh, UHT and canned evaporated) | 4,313,695 | 19.0% | 1,309,770 | 16.4% |
| Meat, poultry and fish (fresh and frozen) | 3,160,205 | 14.0% | 1,133,734 | 14.2% |
| Bread and bread products, cereals, crackers, flour and plain fresh and frozen pasta. | 2,906,139 | 12.8% | 1,087,994 | 13.6% |
| Cheese, yogourt and other dairy products | 1,810,016 | 8.0% | 686,482 | 8.6% |
| Unsweetened juice | 1,005,222 | 4.4% | 407,075 | 5.1% |
| Eggs and egg substitutes | 934,459 | 4.1% | 341,292 | 4.3% |
| Infant products, formula and foods prepared specifically for infants | 668,134 | 2.9% | 201,722 | 2.5% |
| Combination foods (fresh and frozen) | 591,291 | 2.6% | 326,774 | 4.1% |
| Cooking oils, margarine, lard, shortening, butter, mayonnaise and salad dressing | 525,418 | 2.3% | 261,734 | 3.3% |
| Nuts, seeds, peanut butter and other nut butters, tofu and other meat alternatives | 98,031 | 0.4% | 32,311 | 0.4% |
| Personal Hygiene Products | 24,918 | 0.1% | 7,926 | 0.1% |
| Dried herbs & spices, cooking juice | 14,724 | 0.1% | 7,023 | 0.1% |
| Non-prescription drugs | 11,243 | 0.0% | 7,748 | 0.1% |
| Eligible only for the community of Old Crow (Yukon) and Grise Fiord (Nunavut) | 1,916 | 0.0% | 2,275 | 0.0% |
| Country Food | 372 | 0.0% | 617 | 0.0% |
| Total | 22,648,974 | 100% | 7,994,616 | 100% |
| Note: numbers may not add up due to rounding. | ||||
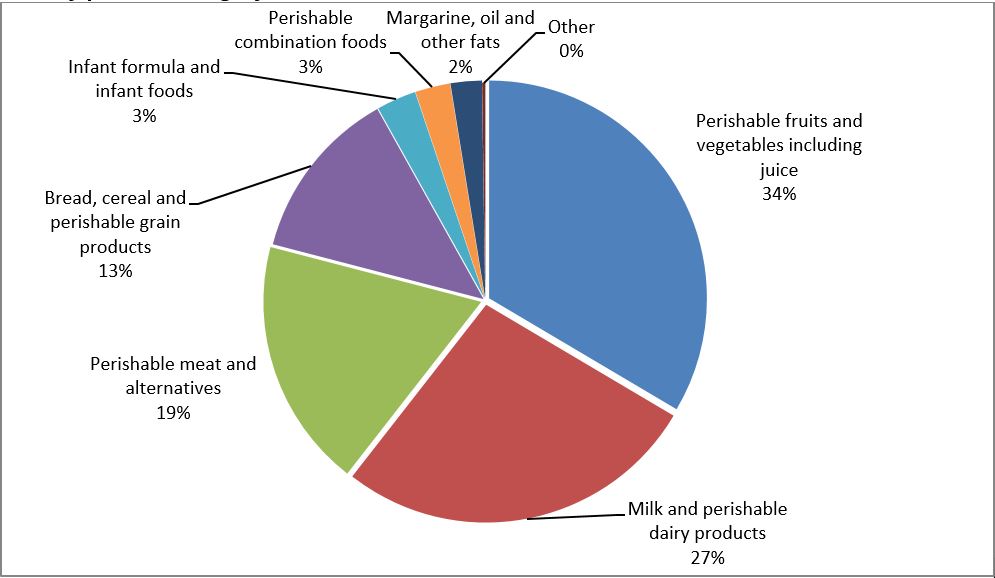
This chart shows what percentage of total subsidy payments was applied to specific product categories between January 1, 2020 and March 31, 2020. Because some categories received less than 1% of the subsidy payments, these categories are combined under the 'Other' category. The chart below is based on data in the table above.
Data by product category
The pie graph breaks down the total amount of subsidy spending between January 1, 2020 and March 31, 2020, by categories of eligible products as follows:
- perishable fruits and vegetables, including juice: 34%
- Fruit and vegetables (fresh and frozen): 29%
- Unsweetened juice: 4%
- milk and other perishable dairy products: 27%
- Milk (fresh, UHT, and canned evaporated): 19%
- Cheese, yoghurt and other dairy products: 8%
- perishable meat and alternatives: 19%
- Meat, poultry and fish (fresh and frozen): 14%
- Eggs and egg substitutes: 4%
- Nuts, seeds, peanut butter and other nut butters, tofu and other meat alternatives: 0%
- bread, cereal and other perishable grain products: 13%
- perishable combination foods: 3%
- infant products: 3%
- margarine, oil and other fats: 2%
- other: 0%:
- dried herbs & spices, cooking juice: 0%
- non-prescription drugs: 0%
- personal hygiene products: 0%
- eligible only for the community of Old Crow (Yukon) and Grise Fiord (Nunavut): 0%
- country food: 0%.
Data by subsidy level
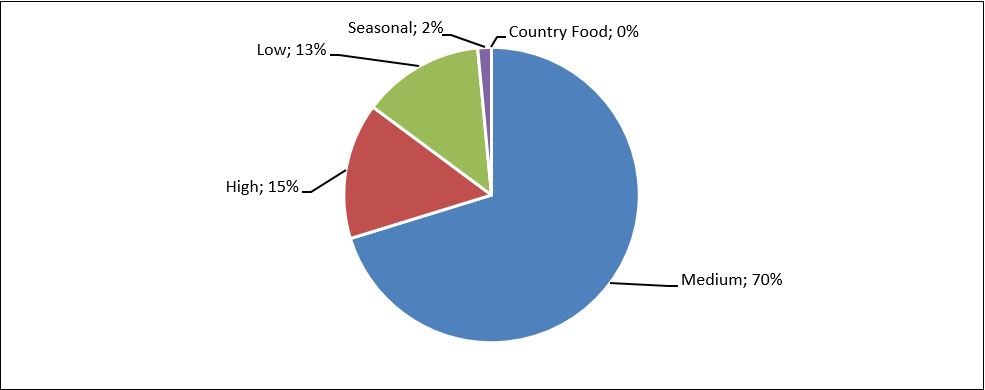
This chart shows what percentage of total payments split between the different subsidy levels available between January 1, 2020 and March 31, 2020.
Subsidy payments by subsidy level
The pie graph breaks down the total amount of subsidy spending between January 1, 2020 and March 31, 2020, by subsidy level, as follows:
- High: 15%
- Medium: 70%
- Low: 13%
- Seasonal: 2%
- Country Food: 0%
Data by province or territory and region
This table shows the amount of subsidy that was distributed by province or territory and region between January 1, 2020 and March 31, 2020, and the product quantities that were subsidized. The province or territory are listed in descending order based on the amount of subsidy. Numbers in the table are preliminary. Values are subject to change. Numbers may not add up due to rounding.
| Province / territory | Region | Subsidy | Volume | ||
|---|---|---|---|---|---|
| Value ($) | % of Total | Weight (kg) | % of Total | ||
| Nunavut | Baffin | 7,230,325 | 31.9% | 1,747,303 | 21.9% |
| Kivalliq | 2,366,655 | 10.4% | 845,934 | 10.6% | |
| Kitikmeot | 1,399,746 | 6.2% | 493,002 | 6.2% | |
| Nunavut Total | 10,996,726 | 48.6% | 3,086,238 | 38.6% | |
| Quebec | Nunavik (Northern Quebec) | 4,799,825 | 21.2% | 1,357,103 | 17.0% |
| Quebec North Shore1 | 327,900 | 1.4% | 133,234 | 1.7% | |
| Quebec Total | 5,127,725 | 22.6% | 1,490,337 | 18.6% | |
| Ontario | Ontario Total | 2,714,056 | 12.0% | 1,505,561 | 18.8% |
| Manitoba | Manitoba Total | 2,132,040 | 9.4% | 1,233,631 | 15.4% |
| Northwest Territories |
Sahtu | 496,462 | 2.2% | 185,891 | 2.3% |
| Beaufort-Delta | 283,011 | 1.2% | 65,827 | 0.8% | |
| Great Slave Lake | 182,007 | 0.8% | 62,228 | 0.8% | |
| Northwest Territories Total | 961,479 | 4.2% | 313,947 | 3.9% | |
| Newfoundland and Labrador | Newfoundland and Labrador Total | 406,441 | 1.8% | 192,298 | 2.4% |
| Saskatchewan | Saskatchewan Total | 115,511 | 0.5% | 69,872 | 0.9% |
| Alberta | Alberta Total | 140,044 | 0.6% | 80,339 | 1.0% |
| Yukon | Yukon Total | 54,953 | 0.0% | 22,394 | 0.0% |
| Total | 22,648,974 | 100% | 7,994,616 | 100% | |
| 1Quebec North Shore communities are eligible for a subsidy from Nutrition North Canada during the months when there is no marine service to these communities (generally from January to March). | |||||
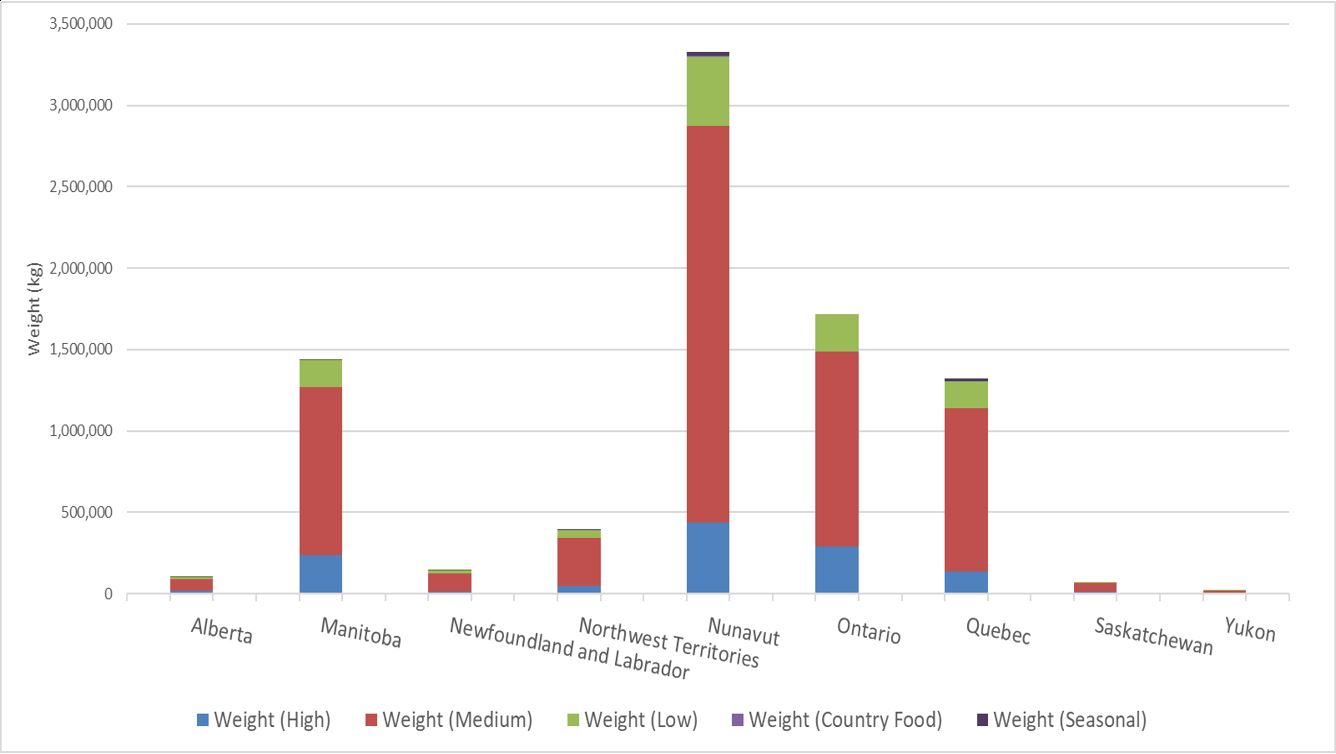
This chart shows weight shipped for each province and territory, split between the subsidy levels available between January 1, 2020 and March 31, 2020. This graph is based on the table below.
Weight shipped by subsidy level for each province and territory
The chart breaks down the total amount of weight shipped between January 1, 2020 and March 31, 2020, by subsidy level and province/territory, as follows:
| Province or territory | Weight by Subsidy level (kg) | ||||
|---|---|---|---|---|---|
| High | Medium | Low | Country Food | Seasonal | |
| Alberta | 15,121 | 72,796 | 11,456 | ||
| Manitoba | 236,835 | 1,034,574 | 161,212 | ||
| Newfoundland and Labrador | 13,202 | 113,321 | 12,838 | ||
| Northwest Territories | 47,048 | 297,440 | 44,568 | 245 | |
| Nunavut | 436,115 | 2,438,796 | 425,788 | 694 | 23,673 |
| Ontario | 286,522 | 1,199,286 | 229,276 | ||
| Quebec | 133,151 | 1,007,266 | 162,560 | 20,024 | |
| Saskatchewan | 9,830 | 53,604 | 9,233 | ||
| Yukon | 2,253 | 13,475 | 5,421 | ||
Data by community
This table shows the amount of subsidy that was distributed by community between January 1, 2020 and March 31, 2020, and the product quantities that were subsidized during this period. Within a province or territory, communities are listed in alphabetic order. Numbers in the table are preliminary. Values are subject to change. Numbers may not add up due to rounding.
| Community | Subsidy | Volume | ||
|---|---|---|---|---|
| Value ($) | % of Total | Weight (kg) | % of Total | |
| Arctic Bay (Ikpiarjuk) | 604,822 | 2.7% | 69,142 | 0.9% |
| Arviat | 415,484 | 1.8% | 200,913 | 2.5% |
| Baker Lake (Qamani'tuuq) | 533,176 | 2.4% | 160,954 | 2.0% |
| Cambridge Bay (Iqaluktuuttiaq) | 294,633 | 1.3% | 156,869 | 2.0% |
| Cape Dorset (Kingait) | 441,954 | 2.0% | 94,553 | 1.2% |
| Chesterfield Inlet (Igluigaarjuk) | 104,378 | 0.5% | 33,011 | 0.4% |
| Clyde River (Kangiqtugaapik) | 453,051 | 2.0% | 67,766 | 0.8% |
| Coral Harbour (Salliq) | 287,131 | 1.3% | 67,894 | 0.8% |
| Gjoa Haven (Uqsuqtuuq) | 341,538 | 1.5% | 102,107 | 1.3% |
| Grise Fiord (Ausuiktuq) | 245,752 | 1.1% | 15,574 | 0.2% |
| Hall Beach (Sanirayak) | 333,084 | 1.5% | 58,588 | 0.7% |
| Igloolik | 787,845 | 3.5% | 138,208 | 1.7% |
| Iqaluit | 2,177,315 | 9.6% | 918,987 | 11.5% |
| Kimmirut | 198,654 | 0.9% | 36,254 | 0.5% |
| Kugaaruk | 230,235 | 1.0% | 57,381 | 0.7% |
| Kugluktuk | 283,472 | 1.3% | 109,133 | 1.4% |
| Naujaat (Repulse Bay) | 322,943 | 1.4% | 76,971 | 1.0% |
| Pangnirtung | 454,289 | 2.0% | 110,267 | 1.4% |
| Pond Inlet (Mittimatalik) | 1,002,725 | 4.4% | 121,562 | 1.5% |
| Qikiqtarjuaq | 179,899 | 0.8% | 37,695 | 0.5% |
| Rankin Inlet (Kangiqtiniq) | 630,798 | 2.8% | 279,957 | 3.5% |
| Resolute | 246,082 | 1.1% | 23,622 | 0.3% |
| Sanikiluaq | 104,855 | 0.5% | 55,086 | 0.7% |
| Taloyoak | 249,868 | 1.1% | 67,511 | 0.8% |
| Whale Cove (Tikirarjuaq) | 72,745 | 0.3% | 26,234 | 0.3% |
| Total | 10,996,726 | 48.6% | 3,086,238 | 38.6% |
| Community | Subsidy | Volume | ||
|---|---|---|---|---|
| Value ($) | % of Total | Weight (kg) | % of Total | |
| Akulivik | 171,614 | 0.8% | 38,429 | 0.5% |
| Aupaluk | 95,084 | 0.4% | 21,207 | 0.3% |
| Chevery | 32,439 | 0.1% | 13,165 | 0.2% |
| Harrington Harbour | 24,735 | 0.1% | 9,897 | 0.1% |
| Inukjuak | 444,747 | 2.0% | 160,043 | 2.0% |
| Ivujivik | 143,386 | 0.6% | 26,839 | 0.3% |
| Kangiqsualujjuaq | 316,840 | 1.4% | 74,940 | 0.9% |
| Kangiqsujuaq | 335,294 | 1.5% | 64,520 | 0.8% |
| Kangirsuk | 244,460 | 1.1% | 46,567 | 0.6% |
| Kuujjuaq | 798,063 | 3.5% | 296,612 | 3.7% |
| Kuujjuarapik | 452,657 | 2.0% | 205,900 | 2.6% |
| La Romaine (Gethsémani) | 106,144 | 0.5% | 41,668 | 0.5% |
| La Tabatière | 33,171 | 0.1% | 13,543 | 0.2% |
| Mutton Bay | 3,811 | 0.0% | 1,576 | 0.0% |
| Port-Menier | 14,251 | 0.1% | 7,621 | 0.1% |
| Puvirnituq | 666,127 | 2.9% | 174,924 | 2.2% |
| Quaqtaq | 221,495 | 1.0% | 40,448 | 0.5% |
| Saint-Augustin / Pakuashipi | 98,013 | 0.4% | 39,638 | 0.5% |
| Salluit | 679,707 | 3.0% | 133,522 | 1.7% |
| Tasiujaq | 137,730 | 0.6% | 33,515 | 0.4% |
| Tête-à-la-Baleine | 15,336 | 0.1% | 6,127 | 0.1% |
| Umiujaq | 92,621 | 0.4% | 39,636 | 0.5% |
| Total | 5,127,725 | 22.6% | 1,490,337 | 18.6% |
| Community | Subsidy | Volume | ||
|---|---|---|---|---|
| Value ($) | % of Total | Weight (kg) | % of Total | |
| Attawapiskat | 244,658 | 1.1% | 139,782 | 1.7% |
| Bearskin Lake | 73,827 | 0.3% | 41,498 | 0.5% |
| Big Trout Lake (Kitchenuhmaykoosib Inninuwug) | 153,441 | 0.7% | 84,971 | 1.1% |
| Cat Lake | 89,778 | 0.4% | 50,486 | 0.6% |
| Deer Lake | 109,600 | 0.5% | 61,401 | 0.8% |
| Eabamet Lake (Fort Hope) | 86,974 | 0.4% | 48,949 | 0.6% |
| Favourable Lake (Sandy Lake) | 305,025 | 1.3% | 172,901 | 2.2% |
| Fort Albany | 116,570 | 0.5% | 66,463 | 0.8% |
| Fort Severn | 116,957 | 0.5% | 44,198 | 0.6% |
| Kasabonika | 148,253 | 0.7% | 83,295 | 1.0% |
| Kashechewan | 238,380 | 1.1% | 136,488 | 1.7% |
| Keewaywin | 59,947 | 0.3% | 33,594 | 0.4% |
| Kingfisher Lake | 86,327 | 0.4% | 48,407 | 0.6% |
| Lansdowne House (Neskantaga) | 33,243 | 0.1% | 18,583 | 0.2% |
| Muskrat Dam | 32,938 | 0.1% | 19,109 | 0.2% |
| North Spirit Lake | 38,457 | 0.2% | 22,154 | 0.3% |
| Ogoki (Marten Falls) | 629 | 0.0% | 428 | 0.0% |
| Peawanuck (Weenusk) | 54,770 | 0.2% | 22,638 | 0.3% |
| Pikangikum | 217,401 | 1.0% | 123,417 | 1.5% |
| Poplar Hill | 51,559 | 0.2% | 28,737 | 0.4% |
| Sachigo Lake | 77,954 | 0.3% | 44,754 | 0.6% |
| Summer Beaver (Nibinamik) | 39,947 | 0.2% | 23,072 | 0.3% |
| Wapekeka (Angling Lake) | 25,082 | 0.1% | 14,346 | 0.2% |
| Weagamow Lake | 103,865 | 0.5% | 57,284 | 0.7% |
| Webequie | 98,601 | 0.4% | 55,907 | 0.7% |
| Wunnummin Lake | 109,874 | 0.5% | 62,701 | 0.8% |
| Total | 2,714,056 | 12.0% | 1,505,561 | 18.8% |
| Community | Subsidy | Volume | ||
|---|---|---|---|---|
| Value ($) | % of Total | Weight (kg) | % of Total | |
| Brochet | 82,535 | 0.4% | 45,665 | 0.6% |
| Gods Lake Narrows | 213,859 | 0.9% | 122,095 | 1.5% |
| Gods River | 81,090 | 0.4% | 46,745 | 0.6% |
| Island Lake (Garden Hill) | 365,751 | 1.6% | 208,062 | 2.6% |
| Lac Brochet | 99,372 | 0.4% | 56,626 | 0.7% |
| Little Grand Rapids | 91,422 | 0.4% | 50,123 | 0.6% |
| Negginan (Poplar River) | 103,102 | 0.5% | 57,576 | 0.7% |
| Oxford House | 198,512 | 0.9% | 114,776 | 1.4% |
| Pauingassi | 42,519 | 0.2% | 23,576 | 0.3% |
| Red Sucker Lake | 89,749 | 0.4% | 50,565 | 0.6% |
| Shamattawa | 139,144 | 0.6% | 78,878 | 1.0% |
| St. Theresa Point | 388,331 | 1.7% | 235,878 | 3.0% |
| Tadoule Lake | 56,702 | 0.3% | 32,504 | 0.4% |
| Waasagomach | 134,538 | 0.6% | 84,896 | 1.1% |
| York Landing | 45,414 | 0.2% | 25,665 | 0.3% |
| Total | 2,132,040 | 9.4% | 1,233,631 | 15.4% |
| Community | Subsidy | Volume | ||
|---|---|---|---|---|
| Value ($) | % of Total | Weight (kg) | % of Total | |
| Aklavik | 6,561 | 0.0% | 4,169 | 0.1% |
| Colville Lake | 52,255 | 0.2% | 10,000 | 0.1% |
| Déline | 127,146 | 0.6% | 49,003 | 0.6% |
| Fort Good Hope (K'asho Got'ine) | 99,094 | 0.4% | 35,737 | 0.4% |
| Gametì (Rae Lakes) | 34,242 | 0.2% | 11,953 | 0.1% |
| Lutselk'e | 55,314 | 0.2% | 19,220 | 0.2% |
| Norman Wells | 139,238 | 0.6% | 60,773 | 0.8% |
| Paulatuk | 77,368 | 0.3% | 20,694 | 0.3% |
| Sachs Harbour | 50,769 | 0.2% | 8,356 | 0.1% |
| Tulita | 78,729 | 0.3% | 30,379 | 0.4% |
| Ulukhaktok (Holman) | 148,313 | 0.7% | 32,608 | 0.4% |
| Wekweèti (Snare Lake) | 16,643 | 0.1% | 5,628 | 0.1% |
| Whati | 75,807 | 0.3% | 25,428 | 0.3% |
| Total | 961,479 | 4.2% | 313,947 | 3.9% |
| Community | Subsidy | Volume | ||
|---|---|---|---|---|
| Value ($) | % of Total | Weight (kg) | % of Total | |
| Black Tickle | 8,325 | 0.0% | 4,726 | 0.1% |
| Hopedale | 51,300 | 0.2% | 28,092 | 0.4% |
| Makkovik | 34,275 | 0.2% | 19,292 | 0.2% |
| Nain | 166,822 | 0.7% | 64,868 | 0.8% |
| Natuashish | 83,000 | 0.4% | 38,966 | 0.5% |
| Postville | 18,214 | 0.1% | 10,386 | 0.1% |
| Rigolet | 44,504 | 0.2% | 25,969 | 0.3% |
| Total | 406,441 | 1.8% | 192,298 | 2.4% |
| Community | Subsidy | Volume | ||
|---|---|---|---|---|
| Value ($) | % of Total | Weight (kg) | % of Total | |
| Fort Chipewyan | 140,044 | 0.6% | 80,339 | 1.0% |
| Total | 140,044 | 0.6% | 80,339 | 1.0% |
| Community | Subsidy | Volume | ||
|---|---|---|---|---|
| Value ($) | % of Total | Weight (kg) | % of Total | |
| Fond-du-Lac | 81,269 | 0.4% | 49,236 | 0.6% |
| Uranium City | 4,327 | 0.0% | 2,640 | 0.0% |
| Wollaston Lake | 29,915 | 0.1% | 17,996 | 0.2% |
| Total | 115,511 | 0.5% | 69,872 | 0.9% |
| Community | Subsidy | Volume | ||
|---|---|---|---|---|
| Value ($) | % of Total | Weight (kg) | % of Total | |
| Old Crow | 54,953 | 0.2% | 22,394 | 0.3% |
| Total | 54,953 | 0.2% | 22,394 | 0.3% |
| Community | Subsidy | Volume | ||
|---|---|---|---|---|
| Value ($) | % of Total | Weight (kg) | % of Total | |
| Nunavut | 10,996,726 | 48.6% | 3,086,238 | 38.6% |
| Quebec | 5,127,725 | 22.6% | 1,490,337 | 18.6% |
| Ontario | 2,714,056 | 9.4% | 1,233,631 | 15.4% |
| Manitoba | 2,132,040 | 9.4% | 1,233,631 | 15.4% |
| Northwest Territories | 961,479 | 4.2% | 313,947 | 3.9% |
| Newfoundland and Labrador | 406,441 | 1.8% | 192,298 | 2.4% |
| Alberta | 140,044 | 0.6% | 80,339 | 1.0% |
| Saskatchewan | 115,511 | 0.5% | 69,872 | 0.9% |
| Yukon | 54,953 | 0.2% | 22,394 | 0.3% |
| Total | 22,648,974 | 100% | 7,994,616 | 100% |